If you’re looking at performance and trying to understand I/O on a per database level in SQL Server, sadly there is not a report in Management Studio that you can run from those available.
It will need some T-SQL to pull out this information from an existing DMV – sys.dm_io_virtual_file_stats.
The information returned by the DMV is data which has been recorded since the SQL Server was last restarted and so it is therefore cumulative data.
It helps the DBA to understand where the I/O distribution is across databases at both the data and log file level.
Let’s take a look at I/O at the database level using this T-SQL:
WITH IO_Per_DB
AS
(SELECT
  DB_NAME(database_id) AS Db
  , CONVERT(DECIMAL(12,2), SUM(num_of_bytes_read + num_of_bytes_written) / 1024 / 1024) AS TotalMb
 FROM sys.dm_io_virtual_file_stats(NULL, NULL) dmivfs
 GROUP BY database_id)

 SELECT
    Db
    ,TotalMb
    ,CAST(TotalMb / SUM(TotalMb) OVER() * 100 AS DECIMAL(5,2)) AS [I/O]
FROM IO_Per_DB
ORDER BY [I/O] DESC;
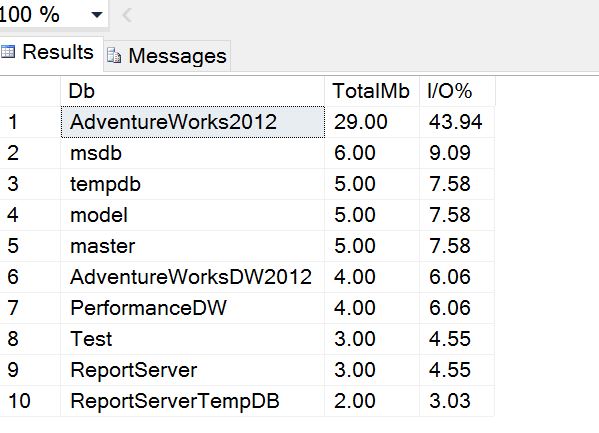
On my test instance this produces the following output:
I can see that the top I/O consumer is the sample MS database AdventureWorks and this is because I’ve been running some simple SELECT’s against the tables. If I start running queries against the others, the distribution will quickly change so it’s important not to assume anything about the results without regular sampling.
Take some scenario where workload patterns are constant across the day and the results do not change much. Then in the evening some large job runs which reads a lot of data from a database which is otherwise not very active during the day. At that time of the day, that database may show up at the top of the report having generated a lot of I/O. However after this time, normal workloads would resume and the results will change again.
Looking at I/O usage at the database file level in SQL Server
The results above are very high level. If you want to look in more detail, for example at the data file level, you can run something like this:
WITH IO_Per_DB_Per_File
AS
(SELECT
    DB_NAME(dmivfs.database_id) AS Db
  , CONVERT(DECIMAL(12,2), SUM(num_of_bytes_read + num_of_bytes_written) / 1024 / 1024) AS TotalMb
  , CONVERT(DECIMAL(12,2), SUM(num_of_bytes_read) / 1024 / 1024) AS TotalMbRead
  , CONVERT(DECIMAL(12,2), SUM(num_of_bytes_written) / 1024 / 1024) AS TotalMbWritten
  , CASE WHEN dmmf.type_desc = 'ROWS' THEN 'Data File' WHEN dmmf.type_desc = 'LOG' THEN 'Log File' END AS DataFileOrLogFile
 FROM sys.dm_io_virtual_file_stats(NULL, NULL) dmivfs
 JOIN sys.master_files dmmf ON dmivfs.file_id = dmmf.file_id AND dmivfs.database_id = dmmf.database_id
 GROUP BY dmivfs.database_id, dmmf.type_desc)

 SELECT
    Db
  , TotalMb
  , TotalMbRead
  , TotalMbWritten
  , DataFileOrLogFile
  , CAST(TotalMb / SUM(TotalMb) OVER() * 100 AS DECIMAL(5,2)) AS [I/O]
FROM IO_Per_DB_Per_File
ORDER BY [I/O] DESC;
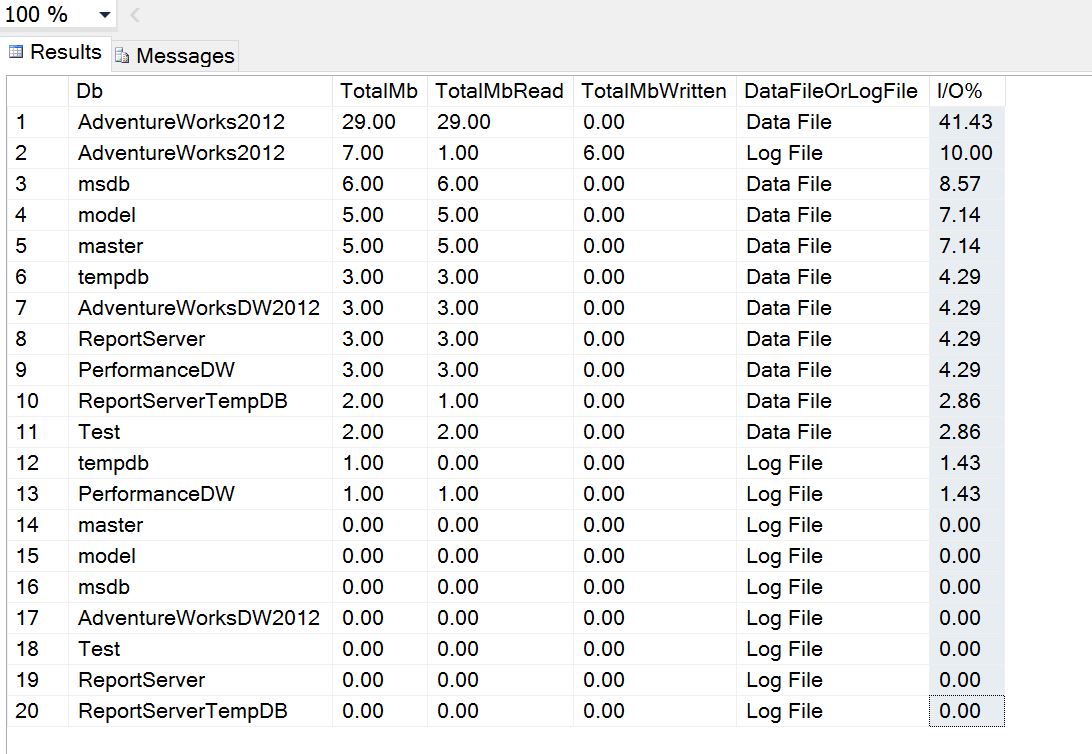
I’ve included some extra columns here to help display the megabytes read and written as well as the data file the I/O was generated against.
In the following results, I ran an update against one of the larger tables to help demonstrate. You can see the log file for the AdventureWorks db saw some activity and the distribution of I/O is now more transparent.


There is a mistake in line 20 of the SQL for the section called “Looking at I/O usage at the database file level in SQL Server”. It should be “FROM IO_Per_DB_Per_File” instead of IO_PER_DB
Thanks for letting me know, I have updated the page. 🙂
Can I get the same data but by query instead? Or is that not possible?