In this series of posts covering the new features in SQL Server 2016, I’m moving on to looking at the Query Store.
This tool provides a way to track query execution plan performance over time to help assist troubleshooting efforts. Figuring out why the database has suddenly started running slowly can be at times difficult to diagnose quickly. The query store is an extra tool in the DBA or developer’s armoury to help in such situations.
The store captures, queries, statistics and execution times for later review. Data is recorded by time making it possible for you to see when query plan changes happened on the server.
This is an improvement over just having query plans available in the query plan cache. The query plan cache only stores the last version of the execution plan and if the server comes under memory pressure, the plans are evicted.
What’s so important about the execution plans?
It’s the execution plans that tell the story about how the optimizer ran the query.
Such plans can be altered say if the table grows and the optimizer decided that instead of an index seek, it will be more efficient to do an index scan.
To name a few more scenarios; there might be a server wide change using sp_configure, some index was changed (or dropped), index statistics were updated, sp_recompile was called or the table schema was changed.
The execution plans are really important to help understand the decisions the optimizer made, enabling the performance troubleshooter to quickly see where the delays are in a given query.
At the time of writing I am using Release Candidate 3 of SQL Server 2016.
How to Enable the Query Store in SQL Server 2016
This is either done using T-SQL or via Management Studio and done on a per database basis.
T-SQL
ALTER DATABASE YourDB SET QUERY_STORE = ON;
Management Studio
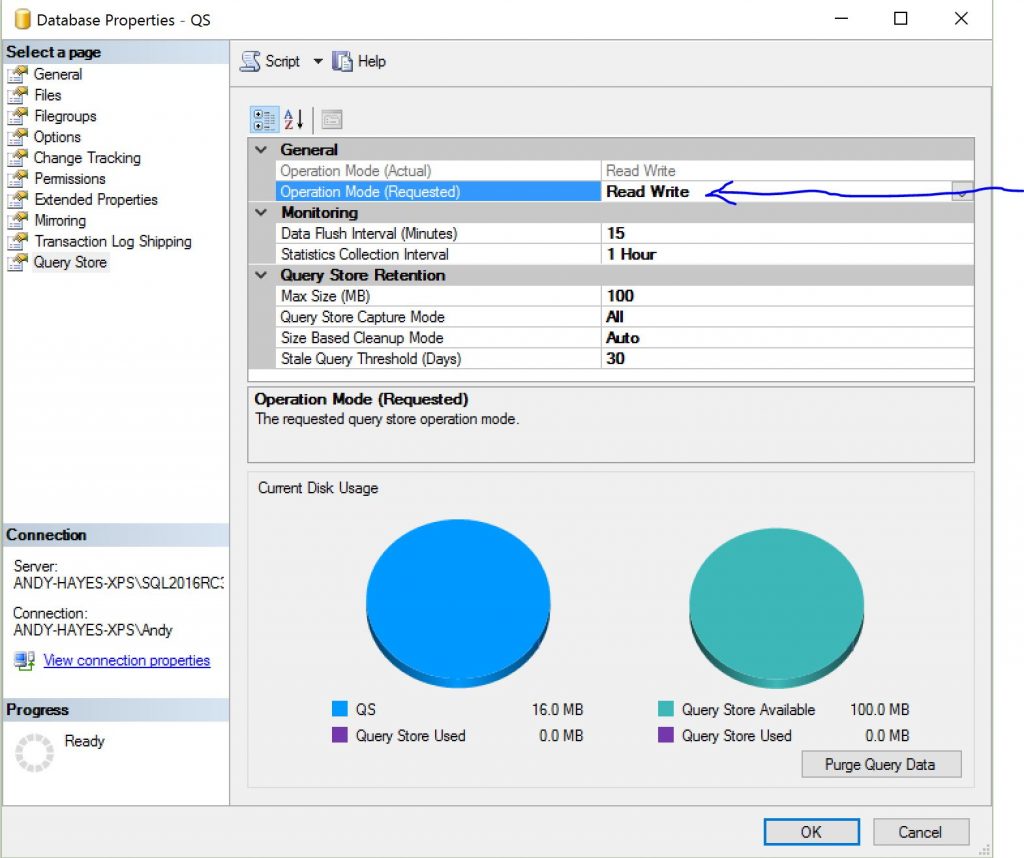
Right mouse click the database you want to enable this for, choose “Properties->Query Store”.
Under “General”, you’ll see “Operation Mode (Requested)”, choose “Read Write” from the list of options.
On this screen that you can see further options, such as how long you want to keep the data in the store before it gets flushed, how big the store can be etc.

When would you typically use the Query Store?
- To implement Plan Forcing
- To determining the number of times a query plan was executed in a given window
- To identify the top (N) queries by resource (CPU etc) in the past (X) hours
- To audit the history of query plans
- To analyze the resource usage patterns of a particular database
Plan Forcing
As there are multiple versions of the execution plan in the query store, it is possible through policies to direct a query to use a specific execution plan – this is known as “Plan Forcing”. By giving instruction to use a specific plan, this can help to quickly resolve a performance issue caused by an execution plan change.
Structure of the query store
The query store is divided up into two stores; the plan store and the runtime stats store. The former contains the execution plan information and the latter contains the execution statistics for each of the plans stored.
Viewing the data in the query store
Once the query store has been enabled, the contents of the store can be viewed using this query:
SELECT Txt.query_text_id, Txt.query_sql_text, Pl.plan_id, Qry.*
FROM sys.query_store_plan AS Pl
JOIN sys.query_store_query AS Qry
ON Pl.query_id = Qry.query_id
JOIN sys.query_store_query_text AS Txt
ON Qry.query_text_id = Txt.query_text_id;
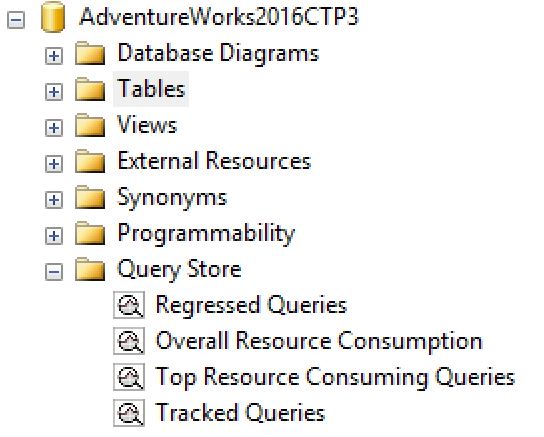
There are also reports available in Management Studio. Under the Query Store section of the database, there are 4 reports exposed :

- Query store regressed queries – these are the queries that have declined in performance. Data is available for each query in both tabular and graph form with differing options to report on metrics for duration, logical reads/writes, cpu time, memory consumption and physical reads.
- Overall Resource Consumption – data is aggregated in graph form of the query runtime statistics during a specific time interval.
- Top Resource Consuming Queries – shows the most expensive queries that were executed during a specific time interval.
- Tracked Queries – shows the runtime statistics at query execution and provides a way for the troubleshooter to view the execution plan of a particular query.
Summary
The query store enables a DBA to record the changes to execution plans over time. Data is presented in easily digestible forms allowing quicker understanding of the reasons why a query might have deteriorated in performance.
It’s neat and it’s most welcome 🙂


Leave a Reply