SQL Server 2016 Live Query Statistics provide a way to look into the execution plan to see what parts of the query are currently running.
The advantage of this feature is that for a slow query, instead of having to wait for it to complete before the execution plan is available, it’s now possible to view the execution plan in real time.
Sometimes execution plans can be huge, increasing the effort needed to work out which parts of the query are performing badly. With Live Query Statistics enabled, seeing this data in real time helps the DBA or developer find the root causes of poor performance faster.
How to Enable Live Query Statistics in SQL Server 2016
There is a new button on the SQL Editor toolbar which is responsible to activating this feature when inside a new query window.

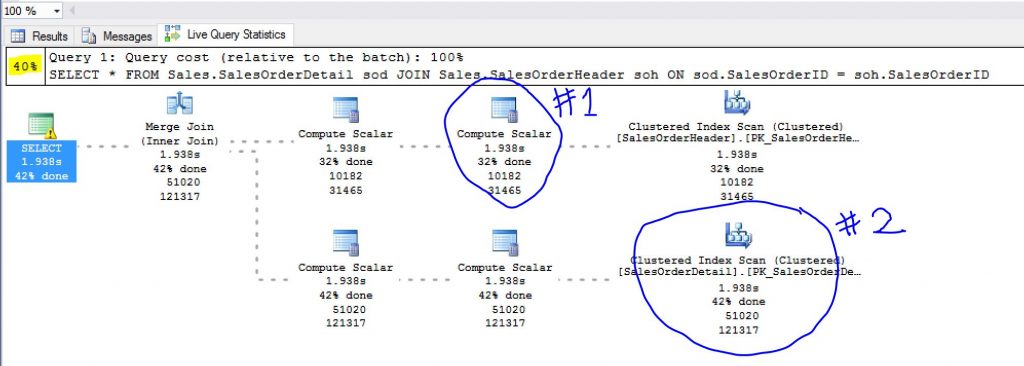
Then simply execute the query and the results will appear on screen. In the following screenshot, the query is still in progress and all operators have not finished.

I have circled two of them and you can see that they are at different stages according to the percentages listed. Overall, the query is 40{3a76cbff1b5ce5ace3bd34bbdd68f71285d81fb9af60114c7a6db80d3a8688de} complete as seen highlighted in yellow. There is data for the number of rows passing through the operator and for the time lapsed on that part of the query.
When the query finishes, you can compare this visualization with the actual execution plan to understand the cost of the components relative to the total cost of the query.
This feature can also be accessed via activity monitor under the “Active Expensive Queries”. Right click the query you are interested in and click “Show Live Execution Plan”
A very nice feature indeed! 🙂


Leave a Reply